.svg)
Case studies / Operations management system
Service depthLayer two|Workflow integration
From a chalkboard to an app
Rebuilding an insurance field office's management view with a method proven over three years.
Background
The head office's system served company-wide management needs, but never reached the day-to-day operations at the field-office level. Sales progress still lived on a handwritten blackboard, while records of client relationships were scattered across personal notebooks; information was hard to bring together, and hard-won know-how broke off whenever someone got busy or moved on.
From understanding to impact
-
01
Understand
Not a missing app, but information scattered across disconnected tools
The blackboard, personal notes, and spreadsheets each stood on their own, and managers couldn't see the full picture.
-
02
Solve
Map a proven method onto roles and workflows
Bring clients, sales, attendance, and approvals together, then give each role a different view according to its responsibility.
-
03
Impact
Management moves from subjective impression to reviewable evidence
The team does not just see results — it understands how they were produced and can carry that learning forward.
The approach
We built a management system that brings client relationships, sales, attendance, and digital approvals together, returning once-scattered data to a single working context.
The right management view for each role
The field-office manager sees the whole team, a supervisor focuses on their own group, and a new hire sees only their own information. Layered permissions aren't a technical showpiece — they map organizational responsibility onto the system: the same data, seen from the angle each role actually needs.
Method before tools
This system's predecessor was an Excel workbook used continuously for three years. We confirmed the management method worked first, then systematized it through AI-assisted development. Technology isn't there to replace the method, but to make a proven method steadier and easier to sustain.
The results
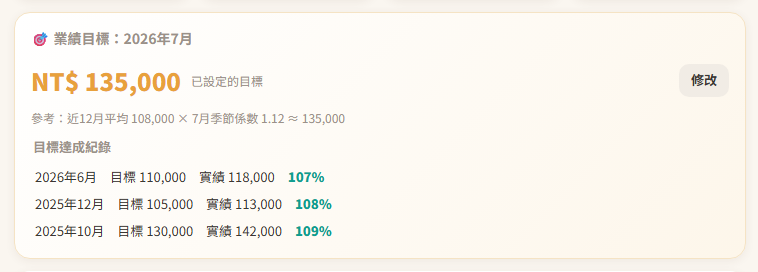
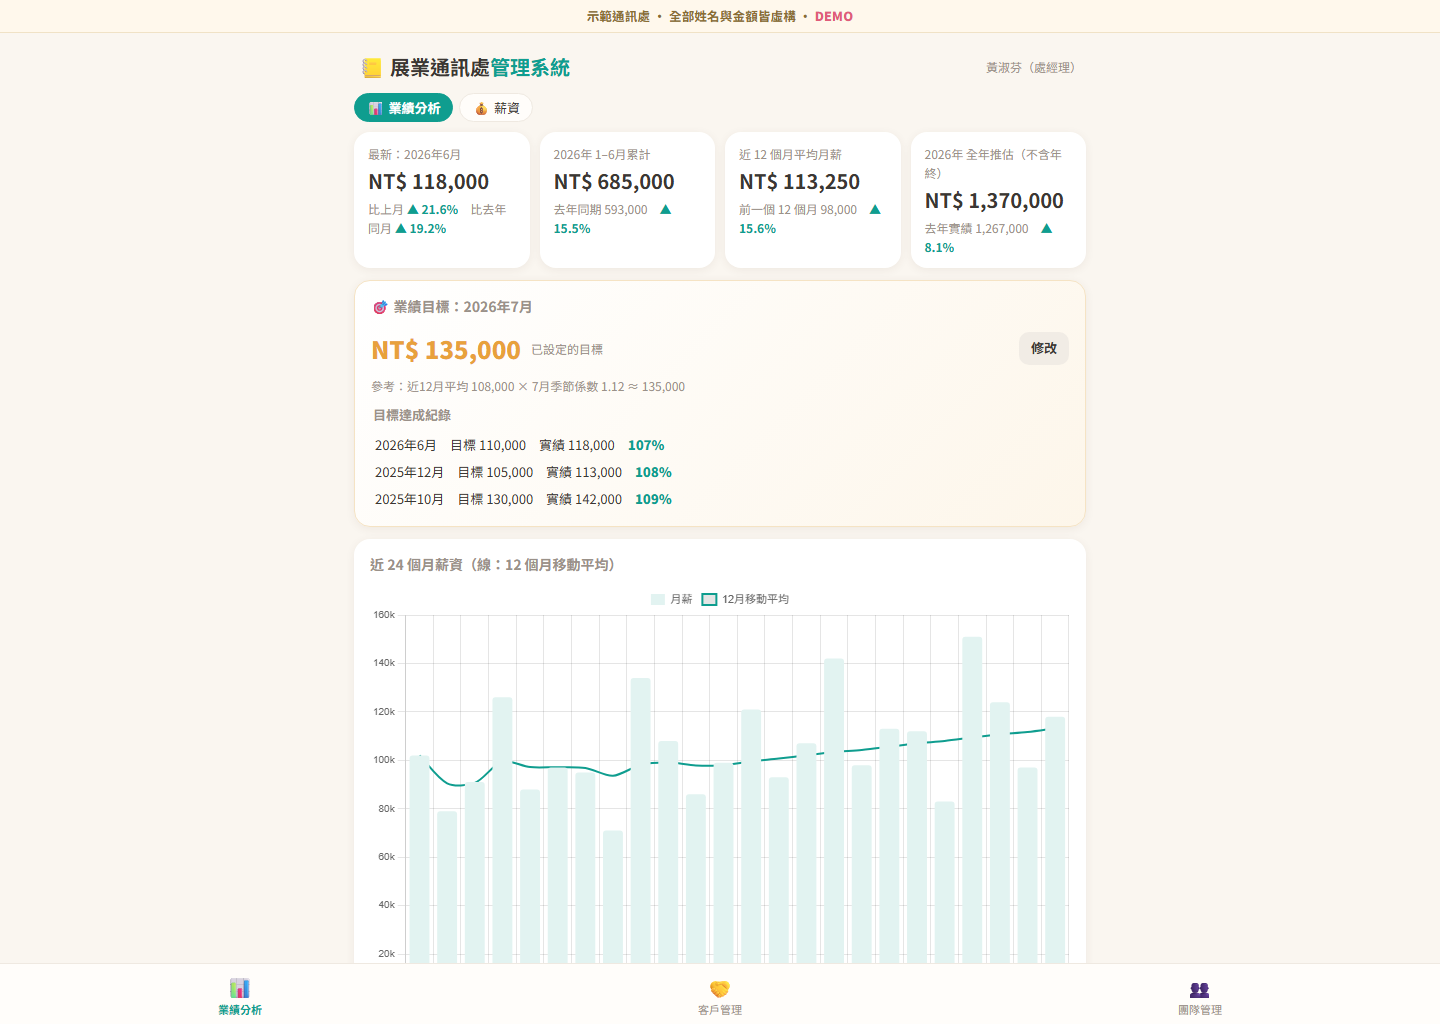
A single team used it continuously for three years, doubling its sales year over year in that time and sustaining clear growth afterward. This is one team's actual experience and is not a guarantee of results for other organizations.
Two deeper changes stand out. First, data corrected subjective impressions: the best month was no longer mistaken for the long-run norm. Second, goals could be broken down: lead volume, close rate, and average deal size each became observable, so managers could pinpoint which link was most worth improving.
The system also keeps a "key-event log" that records the context around important deals. Success that lives only in memory is hard to learn from; once captured in a record the team can revisit, it can become organizational knowledge worth repeating.
A good management system doesn't just show results — it lets the team see how those results took shape.
Is there a “blackboard” in your organizationthat no system has reached yet?
Moving from paper and personal memory to a management method that lasts, the key isn't digitizing everything — it's finding first the information most worth bringing together.